Introduction
Every time a problem happens in production, the first thing we do is open the logs. But how many times have you found something like this?
| |
No OrderId. No CustomerId. No way of knowing which instance it happened on or which version of the application was running. This kind of log exists in thousands of applications — and it helps absolutely no one.
The problem is not a lack of logs. It is a lack of context, a lack of structure and a lack of control. When the application needs more detail, you have to change the configuration, deploy, wait for the restart — and hope you capture the error before rolling back.
In this article, I will show a complete logging strategy for .NET 8 that solves these three problems at once:
- Structured: each log entry carries typed properties, not just plain text
- Contextual: every log line automatically includes information about the application, the host and the request
- Dynamic: the log level can be changed in production with an automatic rollback timer — no deploy, no restart
All of this using native ILogger<T>, without unnecessary wrappers, compliant with SonarQube and integrated with Azure Application Insights.
The complete implementation is available in the blog-zocateli-sample repository on GitHub. Throughout the article, I will show the key snippets and explain the reasoning behind each decision. If you want to see the full context at any point, check the sources in the repository.
📦 Source code: The complete implementation of this article is in the blog-zocateli-sample repository on GitHub. Clone it, explore it and adapt it to your context.
💡 This article complements the .NET 8+ Configuration Pipeline, which explains how the configuration system,
IOptions<T>and secrets work. The logging strategy described here depends directly on those concepts.
The Problem: Why Your Logs Don’t Help
Consider these two real production log scenarios:
Before — log without context:
| |
A support analyst looks at this and cannot answer a single question: which order? Which customer? On which instance? Was it the new version or the old one? Does this error reproduce or was it a one-off?
After — structured log with context:
| |
With this second format, the analyst can:
- Filter by
OrderIdto see everything that happened to that order - Group by
HostNameto identify whether the problem is specific to one instance - Use the
CorrelationIdto trace the whole pipeline of a single request - Compare
ApplicationVersionto know whether the bug comes from the new version
The cost of troubleshooting drops drastically. Instead of hours digging through generic logs, you find the cause in minutes with a query in Application Insights.
💡 A log without context in production is like searching Google for an error without typing the error message — technically you are searching, but you will not find anything useful.
Structured Logging: What It Is and Why It Matters
Structured logging means that each log entry carries typed, indexable properties, not just a concatenated string.
In .NET, the difference is subtle in the code but huge in the result:
| |
When you use the template with {OrderId}, ILogger preserves the value as a separate property. In Application Insights, it appears in customDimensions and can be filtered, aggregated and correlated with KQL queries. When you use string interpolation with $, the value is embedded in the message — Application Insights receives only text and cannot index it.
The practical consequences are straightforward:
- With structured properties:
customDimensions["OrderId"] == "3fa85f64..."— filterable - With an interpolated string: you need
containsor a regex on the message — slow and imprecise
Beyond the functional issue, SonarQube flags string interpolation in logs as rule S6664 (Log message template should be compile-time constant), since it can hurt performance and you lose the ability to group similar messages.
⚠️ Never use
$"Order {orderId}"in log calls. It creates a new string on every call (even when the log level is disabled) and loses the structured property. Always use the template:"Order {OrderId}".
Automatic Enrichment: Application Context in Every Log
If every developer has to remember to include ApplicationName, HostName and CorrelationId in each log call, it is not going to happen. The solution is to enrich automatically.
Middleware with ILogger.BeginScope()
ILogger supports scopes — a block that adds properties to every log entry made inside it. By combining this with a middleware, we guarantee that every log of any request carries the application context:
| |
The middleware is registered as a singleton (because it implements IMiddleware) and enabled in the pipeline:
| |
The ApplicationName and Version properties come from a dedicated section of appsettings.json:
| |
ℹ️ The
LoggingOptionsclass is configured through theIOptions<T>pattern. If you want to understand in depth how this mechanism works, see the article about the .NET 8+ Configuration Pipeline.
TelemetryInitializer for Application Insights
BeginScope() enriches the ILogger logs, but the telemetry Application Insights captures automatically (HTTP requests, dependencies, exceptions) does not go through ILogger. To ensure that all telemetry carries the same properties, we use an ITelemetryInitializer:
| |
Registered in DI as:
| |
With these two pieces, you have full coverage: LogEnrichmentMiddleware for ILogger logs and ApplicationTelemetryInitializer for request traces, dependency calls and exceptions captured automatically by the SDK.
Dynamic Log Level with an Automatic Timer
A real scenario: your production application is behaving strangely. You need to see Debug-level logs to understand what is going on. But the production appsettings.json is configured with Information.
The traditional path would be: change the configuration, deploy (or restart), capture the detailed logs, and then undo everything so as not to drown Application Insights in volume (and cost). This process can take from minutes to hours depending on your pipeline.
The solution proposed here is an administrative endpoint that changes the log level at runtime, with an automatic rollback timer:
| |
After 15 minutes, the level automatically returns to the one configured in appsettings.json. No deploy. No restart. No risk of forgetting Debug turned on.
The Mechanism: A Custom ConfigurationProvider
The .NET logging system reads log levels from the configuration pipeline. The key that defines the default level is Logging:LogLevel:Default, and per category it is Logging:LogLevel:{CategoryName}.
The strategy is to create a custom ConfigurationProvider that can be updated at runtime and that, when changed, triggers OnReload() to notify the framework:
| |
The critical point is the registration: this provider must be added last in the configuration pipeline, so that its value overrides the one from appsettings.json:
| |
The Service with a Timer
DynamicLogLevelService orchestrates the change and automatic rollback logic:
| |
Important points about this implementation:
- The
Timeris created withTimeout.InfiniteTimeSpanas the period — it runs only once after thedueTime - If
SetLogLevelis called again before the timer expires, the previous timer is disposed and a new one is created - The
lockguarantees thread safety between the timer (which runs on a ThreadPool thread) and concurrent calls IDisposableis implemented for proper cleanup of theTimer
💡 Protect this endpoint with proper authorization — in production, only administrators should change the log level. See the article about Authentication and Authorization with JWT, OAuth2 and OpenID for protection strategies.
Native ILogger: No Reinventing the Wheel
A pattern I see with worrying frequency is the creation of an ICustomLogger or LogService that wraps ILogger<T>:
| |
This wrapper breaks several mechanisms:
- The log category always becomes
CustomLoggerinstead of the real class that originated the log - Namespace filters (
Logging:LogLevel:MyNamespace) stop working - Traceability in Application Insights suffers
- Tests become more complex (you need to mock the wrapper instead of ILogger)
The correct approach in modern .NET is to use ILogger<T> directly and the [LoggerMessage] attribute to generate the log methods through a source generator:
| |
Benefits of the [LoggerMessage] Source Generator
- Performance: the source generator creates code that checks the log level before building the message — zero allocation when the log is disabled
- AOT-friendly: compatible with Native AOT, no reflection at runtime
- SonarQube compliance: satisfies rules S6664 (compile-time constant template), S2629 (logging guard) and S6667 (structured logging)
- EventId: each message has a fixed numeric ID, which makes alerts and dashboards easier
- Testable: since they are static methods with
ILoggeras a parameter, passing a mock in tests is trivial
Usage is straightforward in any endpoint or service:
| |
⚠️ Creating an
ICustomLoggerthat wrapsILogger<T>adds a layer with no value, breaks traceability and makes testing harder. UseILogger<T>directly with[LoggerMessage]— it is the correct abstraction.
Integration with Azure Application Insights
Application Insights is Azure’s APM (Application Performance Management) that automatically captures HTTP requests, dependencies (databases, HTTP clients, queues) and exceptions. The structured logging we implemented complements this automatic telemetry with business context.
Setup
The configuration is minimal — one line in Program.cs and the connection string in the configuration:
| |
| |
⚠️ Never put the connection string directly in the source code or in a committed
appsettings.json. Use environment variables, Azure Key Vault or User Secrets for local development. See how to configure it in the article .NET 8+ Configuration Pipeline.
How the Structured Log Shows Up in Application Insights
When you log with [LoggerMessage] and structured properties, each property appears in customDimensions in Application Insights. Combined with the properties injected by LogEnrichmentMiddleware and ApplicationTelemetryInitializer, the result is:
| Column | Value |
|---|---|
message | Order 3fa85f64… created for customer C-1234, total: 150.00 |
customDimensions.OrderId | 3fa85f64-5717-4562-b3fc-2c963f66afa6 |
customDimensions.CustomerId | C-1234 |
customDimensions.Total | 150.00 |
customDimensions.ApplicationName | SampleApi |
customDimensions.ApplicationVersion | 1.0.0 |
customDimensions.HostName | pod-api-7b4f9c |
customDimensions.CorrelationId | 0HN6KQ2JH2S5E:00000001 |
KQL Queries for Troubleshooting
With these indexed properties, queries in Application Insights become surgical:
| |
ℹ️ Application Insights already captures HTTP requests, dependencies and exceptions automatically — structured logging complements it with the business context that only your application knows.
The Sample Application
The sample application implements every concept in this article in a .NET 8 Minimal API. The project structure organizes the logging components in a dedicated folder:
| |
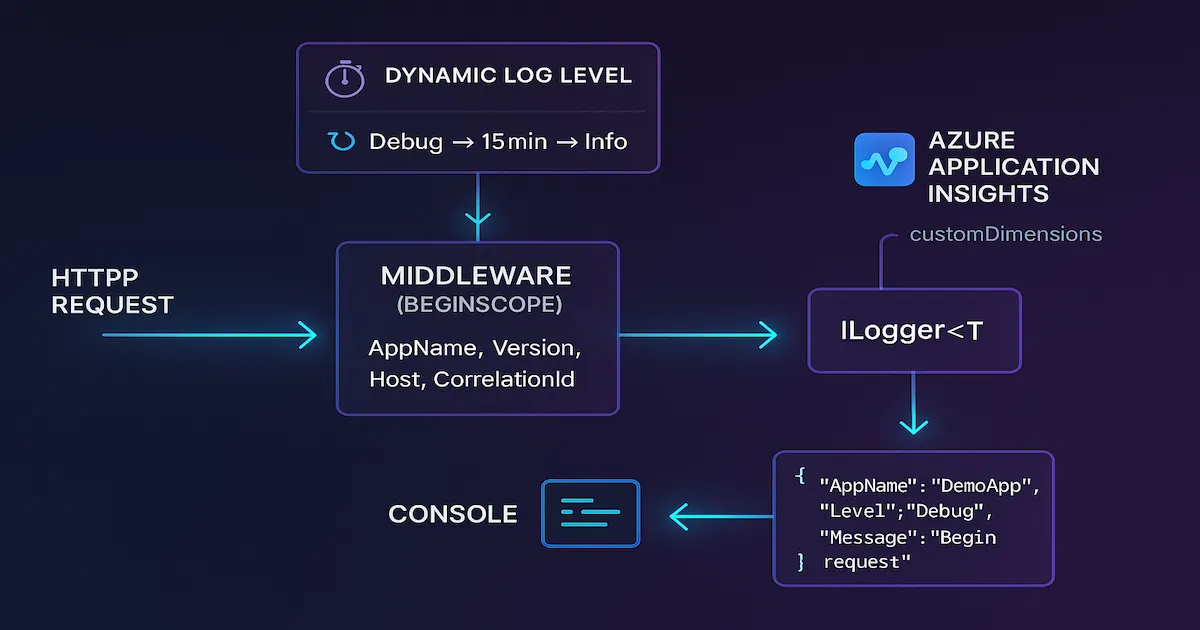
The diagram above shows how the components connect: each HTTP request goes through LogEnrichmentMiddleware, which opens a BeginScope() with the context properties. Any log call made within that request — whether in endpoints, services or internal libraries — automatically inherits those properties. In parallel, ApplicationTelemetryInitializer ensures that Application Insights’ automatic telemetry (requests, dependencies) also carries the same information.
How to Run Locally
| |
Test the dynamic log endpoint:
| |
The complete repository with detailed instructions is at github.com/lzocateli/blog-zocateli-sample — Logging.
Tips and Good Practices
Here are the practices I consider essential for a robust logging strategy:
Use log categories deliberately: .NET uses the class namespace as the category (
ILogger<OrderService>produces the categorySampleApi.Endpoints.OrderService). This lets you filter by namespace inappsettings.json— for example,"SampleApi.Endpoints": "Debug"enables debug only in the endpoints without affecting the rest of the application.Never log sensitive data: names, CPFs (Brazilian taxpayer IDs), tokens, passwords and financial data must not appear in logs. Besides the security risk, Brazil’s LGPD requires the protection of personal data. If you need to trace a user, use an opaque identifier such as
CustomerId.Control Application Insights cost: at high volume, Application Insights charges for data ingestion. Use adaptive sampling to reduce volume without losing visibility. The SDK’s default configuration already includes sampling — avoid disabling it without a cost calculation.
Consistent EventId per message: each
[LoggerMessage]should have a unique, fixedEventId. This lets you create alerts in Azure Monitor based on the EventId (more reliable than a regex on the message) and makes operations dashboards easier.Development environment with a JSON console: configure
appsettings.Development.jsonto use theJsonConsoleFormatterwithIncludeScopes: true. This shows the structured properties right in the terminal during development, without needing Application Insights.Test your logs: with
[LoggerMessage]andILogger<T>, it is trivial to verify in unit tests that the correct logs were emitted. The sample application includes middleware tests that verify the properties injected into the scope.Log administrative operations as Warning: log level changes, restarts and manual operations should be logged as
Warning— visible by default and easy to audit.
Conclusion
Efficient logging is not about quantity — it is about quality and context. In this article, we covered three pillars that, together, turn logs from noise into a diagnostic tool:
- Structure: typed properties with the
[LoggerMessage]source generator instead of concatenated strings - Automatic context:
LogEnrichmentMiddlewarewithBeginScope()andApplicationTelemetryInitializerensure that every log entry carries information about the application, the host and the request - Dynamic control: a custom
ConfigurationProviderwithOnReload()and a timer lets you enableDebugin production safely and temporarily
All of this works with .NET’s native ILogger<T> — no wrappers, no invented abstractions, no SonarQube violations. Application Insights receives the properties in customDimensions, enabling surgical KQL queries for troubleshooting.
If your application still uses _logger.LogInformation($"Processing order {id}"), now is a good time to evolve. Clone the sample repository, adapt it to your context and see the difference the next time you need to investigate a problem in production.
To work with logs in long-running background services, see how to apply this same strategy in .NET Worker and Background Service.
Read Also
- .NET 8+ Configuration Pipeline —
IOptions<T>, Secrets and externalized configuration that support the logging strategy - .NET Worker and Background Service — logging in high-volume background services
- Database Bottlenecks: Messaging and Pagination — performance troubleshooting where logs are essential
- Asynchronous Programming with C# — async/await and execution context that affect log scopes
- Authentication and Authorization with JWT and OAuth2 — protecting administrative endpoints such as the dynamic log level one
References
- Logging in .NET — Microsoft Learn
- LoggerMessage source generator — Microsoft Learn
- Compile-time logging source generation — Microsoft Learn
- Application Insights for ASP.NET Core — Microsoft Learn
- Configuration in ASP.NET Core — Microsoft Learn
- Log scopes — Microsoft Learn
- Azure Monitor KQL reference
- Application Insights sampling — Microsoft Learn
- SonarQube rule S6664 — Log message template
- SonarQube rule S2629 — Logging templates should be constant
- blog-zocateli-sample repository — Logging — Complete source code for the examples in this article
By commenting, you agree to our Privacy Policy, Terms of Use, Data Deletion Policy.